Decoding Football Betting Odds Through Data Patterns and League Dynamics
Written by Mia Berger · Aug 25, 2026
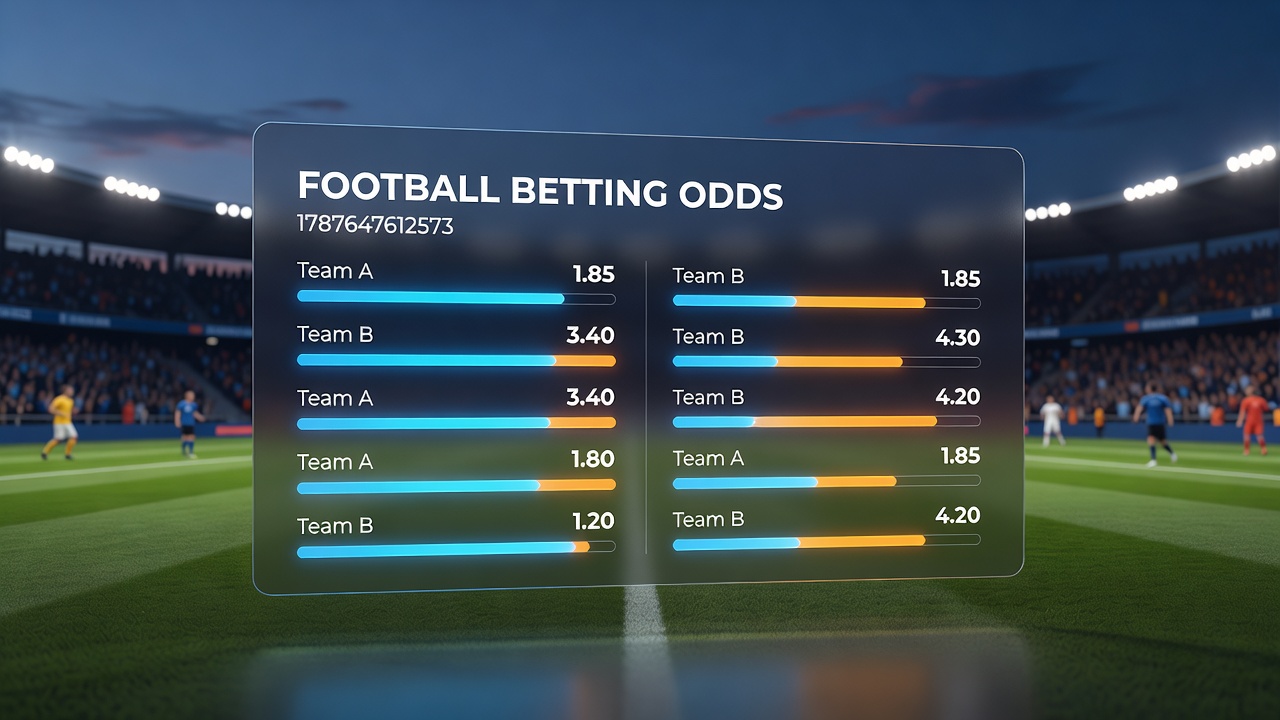
Decoding Football Betting Odds Through Data Patterns and League Dynamics
Football betting odds represent numerical expressions that bookmakers use to balance risk and reward across thousands of wagers each week, and these figures emerge from algorithms that incorporate historical results, current squad statistics, and betting volume. Data from major European leagues shows that opening odds often shift within hours of release as sharp money enters the market, and observers note that such movements frequently signal informed positions rather than random fluctuations. In August 2026 pre-season windows, analysts tracked similar patterns ahead of the new campaign where team news and transfer activity triggered rapid adjustments across Premier League and Bundesliga fixtures alike.
Core Components in Odds Calculation
Bookmakers compile probabilities for outcomes like match winners, over-under totals, and Asian handicaps before converting those figures into formats that include decimal, fractional, and American styles, while margins built into the numbers ensure operational viability. Researchers at institutions tracking global gambling markets have documented how models weigh variables such as home advantage percentages, which average around 45 percent in top divisions, alongside injury reports and weather conditions that alter expected goal outputs. Those who've examined datasets from multiple seasons find that Poisson distribution methods remain common for goal forecasting, yet machine learning layers now refine projections by factoring in player tracking metrics from optical systems.
Take one dataset released in mid-2026 that examined over 2,000 matches across five leagues, and the findings revealed consistent underestimation of draw probabilities in early-week lines until late adjustments corrected the imbalance. External factors including referee assignments and travel distances also enter the equations, and experts have observed that these elements produce measurable edges when aggregated over large sample sizes.
Market Influences and Live Adjustments
Betting volumes directly shape final odds as operators hedge exposure through exchanges and reinsurance layers, and sharp movements often trace back to syndicates or institutional players rather than recreational activity. According to reports from the European Gaming and Betting Association, football accounts for roughly 60 percent of sports wagering turnover in regulated markets during peak periods, while live in-play betting has expanded to represent over half of total handle in several jurisdictions. Those monitoring exchange platforms note that odds can compress or expand within seconds of a goal or red card, creating opportunities that close almost as quickly as they appear.

What's interesting here is how correlated markets interact, with corners, cards, and player props moving in tandem when main lines shift. Studies from Canadian regulatory bodies have shown that liquidity levels in secondary markets determine how far odds can deviate before arbitrageurs step in, and such activity keeps prices aligned across operators. In August 2026, pre-season friendlies demonstrated similar dynamics where low-volume lines produced wider spreads until sufficient action arrived.
Regional Variations in Presentation and Regulation
Odds formats differ by geography, with fractional expressions dominating in Britain while decimal prevails across continental Europe and Australia, and American moneyline styles appear more frequently in North American platforms. A University of Nevada Las Vegas research paper examined how these presentation differences affect bettor comprehension, and the analysis indicated that decimal odds reduce calculation errors among newer participants. Government agencies in Australia have tracked steady growth in football wagering since expanded legalization, with figures showing annual increases tied to digital access and mobile integration.
Those who've studied cross-border flows observe that currency conversions and tax treatments further influence displayed prices, whereas operators in lower-tax environments often post tighter margins. Data indicates that promotional boosts and enhanced odds offers temporarily flatten the house edge, yet long-term profitability metrics remain stable when measured across thousands of events.
Conclusion
Football betting odds function as dynamic reflections of probability estimates refined by incoming data and market pressure, and continued evolution in analytics promises further precision in future seasons. Observers tracking these systems note that transparency around methodology and regulatory oversight will shape how lines develop across expanding global markets.