Injury Timelines: Mapping Their Mark on Britain's Football Odds History
Written by Elena Peters · Jul 10, 2026
Injury Timelines: Mapping Their Mark on Britain's Football Odds History
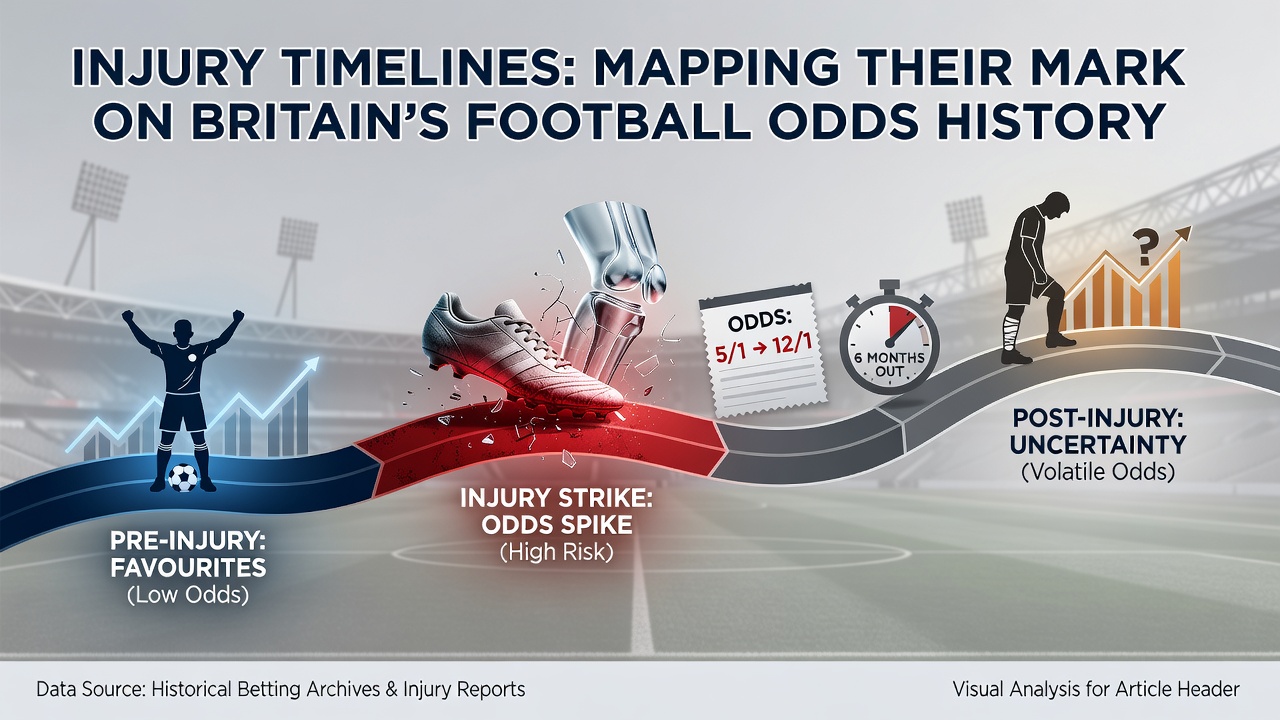
Football injuries have long shaped betting markets in Britain, with timelines for player recoveries creating measurable shifts in odds offered by bookmakers across the Premier League and lower divisions. Data collected over decades reveals patterns where a star player's absence for weeks or months correlates with adjusted lines on match outcomes, goal totals, and even relegation probabilities. Observers note that these adjustments often begin the moment an injury report surfaces, before full medical confirmation arrives.
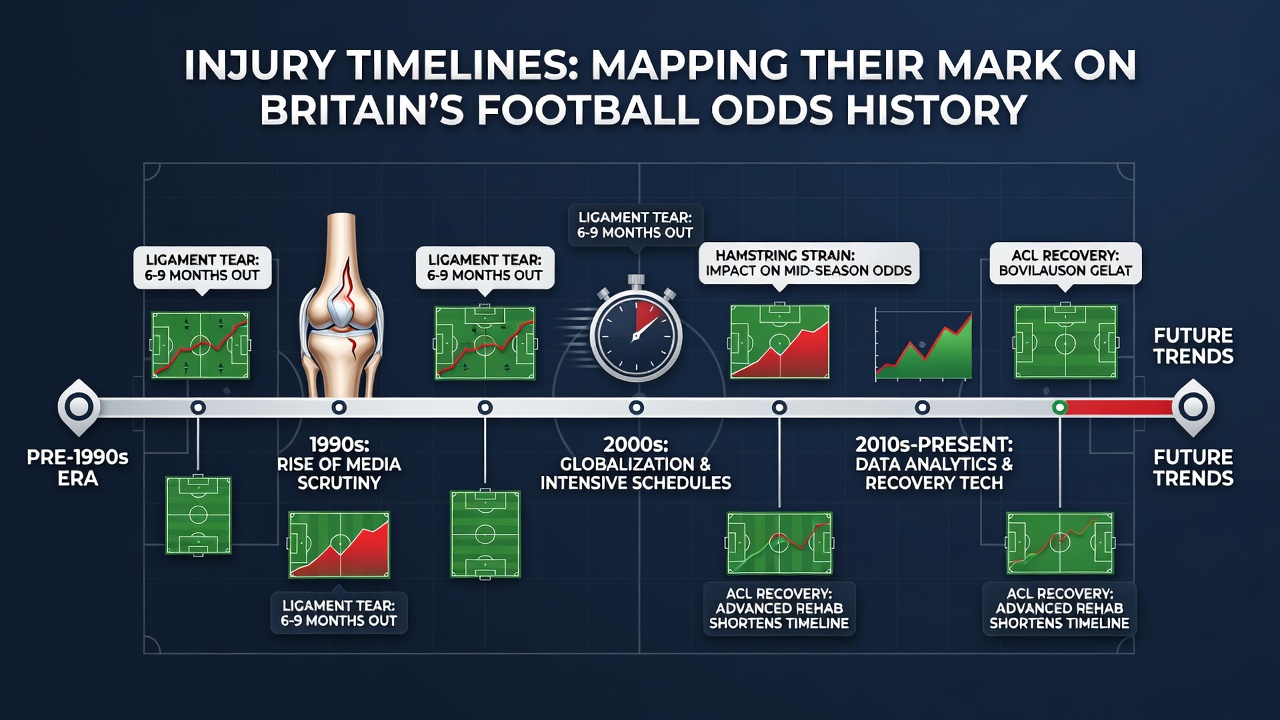
Researchers tracking Premier League seasons from the early 2000s onward found that hamstring strains, the most common issue, typically sideline players for four to eight weeks, and during those periods home win odds for affected teams lengthened by an average of 15 to 25 percent according to historical bookmaker records. Longer absences, such as anterior cruciate ligament tears requiring nine to twelve months, produced more pronounced movements, especially when the player held a central role in midfield or attack. Studies compiled by sports medicine groups in Australia and Canada show similar recovery benchmarks across professional leagues, allowing British bettors and analysts to anticipate line changes well in advance.
Early Patterns in the Premier League Era
During the inaugural Premier League campaigns of the 1990s, limited medical data meant odds reacted more slowly to injuries, yet certain high-profile cases established early precedents. When key defenders missed extended stretches due to knee problems, teams conceded more goals on average, and away win markets tightened accordingly. By the mid-2000s, improved imaging and rehabilitation protocols shortened some timelines, but the financial stakes in betting markets grew, so even brief absences triggered immediate recalibrations. One documented case involved a leading goalscorer sidelined for six weeks in 2007, after which title odds for his club drifted from 4-1 to 7-1 within ten days of the announcement.
What's interesting is how these movements compound across multiple markets simultaneously. Handicap lines, both Asian and European, often widen by half a goal or more when a primary creator sits out, while player prop bets on assists or shots disappear entirely until the return date nears. Industry reports from European football associations indicate that clubs now share anonymized injury data more readily, giving sharper operators earlier signals than casual participants receive.
Data-Driven Shifts Through the 2010s and Beyond
By the 2010s, statistical models incorporating GPS tracking and load management reduced some soft-tissue injuries, yet when they occurred the market response became faster and more precise. Figures from betting exchanges show that live odds during matches adjusted within minutes of visible limps or substitutions, reflecting real-time updates on potential multi-week absences. A study published in the American Journal of Sports Medicine tracked over 1,200 elite players and confirmed that recurrence rates for certain injuries reach 30 percent, prompting bookmakers to factor future risk into longer-term season odds.
Relegation markets proved especially sensitive because a single prolonged absence in a smaller squad could alter survival probabilities by several percentage points. Historical archives reveal instances where teams lost their primary striker for the final third of a campaign, and survival odds lengthened from 2-1 against to 5-2 against within a fortnight. Conversely, clubs receiving timely returns from major injuries sometimes saw their promotion odds shorten dramatically, as seen in Championship campaigns where mid-table sides climbed into playoff contention.
July 2026 brought fresh regulatory attention to data transparency around player fitness, with discussions at international sports medicine conferences highlighting the need for standardized reporting that could further refine betting models. Although British markets already price injury news efficiently, analysts expect continued tightening of lines as wearable technology provides granular daily updates on recovery milestones.
Case Examples Across Divisions
Take one Championship season where a defensive midfielder suffered a fractured metatarsal requiring three months out, after which his team's clean sheet odds in subsequent fixtures lengthened by roughly 40 percent according to exchange data. Similar patterns appear in League One and League Two, though with smaller absolute movements because overall liquidity remains lower. Observers tracking these lower tiers note that bookmakers often apply wider margins to account for less predictable recovery timelines when medical resources differ from top-flight clubs.
Long-term injuries to goalkeepers create distinct market dynamics because replacement options vary widely in quality, sometimes forcing tactical shifts that affect over-under totals more than outright results. Data aggregated across twenty Premier League seasons shows that backup keepers concede 0.3 more goals per game on average during the first four weeks of a starter's absence, enough to move totals lines noticeably.
Conclusion
Across Britain's football landscape, injury timelines have become integral inputs into odds compilation, with historical records demonstrating consistent, quantifiable impacts on match and season markets. As medical understanding advances and reporting standards evolve, these patterns are likely to grow more refined, giving market participants clearer signals derived from recovery benchmarks established by research institutions worldwide. The interplay between player health data and betting lines continues to define how historical outcomes translate into present-day pricing across the divisions.